Stay in the know
We’ll send you the latest insights and briefings tailored to your needs
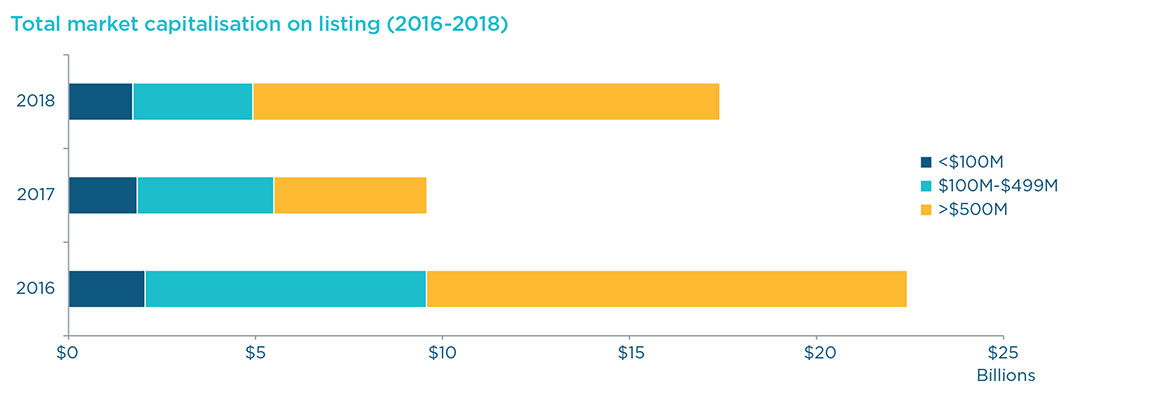
2018 was a better year for mid to large cap IPOs than 2017, which saw the withdrawal of almost all the high profile IPO candidates for various reasons, but was not as successful as 2016 which benefited from a number of family and private equity backed partial exits. Whilst there were fewer listings than 2017, the IPOs in 2018 raised over $3 billion more in capital than the previous year.
Now in our third year of writing the Australian IPO Review, we have this year included charts to show some of the trends over the last three years. Over this period, IPO windows with appropriate conditions for launch have been tight with a minefield of market moving events that intensified in 2018 with the dawning of the realisation that there could be a no-deal Brexit, increasing trade tensions between the US and China, US mid-term elections, the US-North Korea summit and changing Australian prime ministers. See 2018 Australian IPO Review: Key US securities developments for details of the impact of the US political environment on US securities law regulation in 2018.
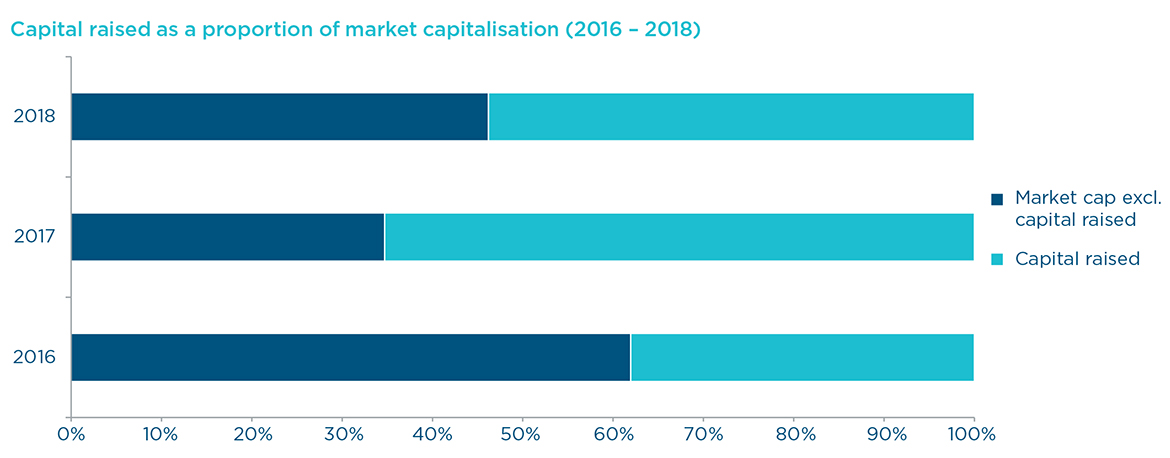
One trend worth noting is the relative consistency of the amount raised as a proportion of market capitalisation. For the last three years, the average amount raised by floats as a proportion of market capitalisation was in the 35-55% range. This is potentially indicative of the level of comfort that the Australian market has with founders and previous owners exiting their investments on IPO, that is that an escrow period alongside a partial exit is generally required.


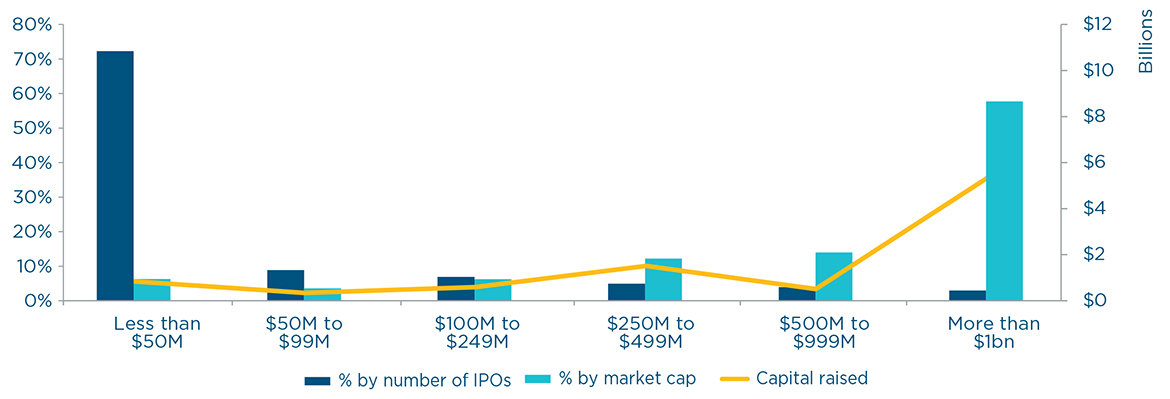
In 2018, consistent with trends in previous years, over two thirds of the capital raised by IPOs on the ASX was by the few listings with a market capitalisation of over $500 million, while over two thirds of the listings by number raised less than $50 million per float and less than a tenth of the overall capital raised by IPOs on the ASX in 2018.

There was less diversity of countries in which listing issuers were incorporated this year. However, Coronado Global Resources, the second largest IPO of 2018, is a US Delaware company and its choice of listing on the ASX, given that it has US and Australian based mines, is notable. ASX updated its practises for Reg S Category 3 listings in connection with this IPO to allow greater US investor access in the after market.
In addition to Coronado, German company Marley Spoon and Delaware company Pivotal Systems Corporation showed that the ASX is a viable option for substantial foreign incorporated companies.

A higher proportion of IPOs were not underwritten in 2018 as compared with previous years. The three year trend shows a reduction in underwriting of IPOs with a market capitalisation of over $100 million.


The prominent floats for 2018 spanned a range of industries from the largest float of the year, downstream petroleum company Viva Energy Group, to large-scale mining companies led by metallurgical coal producer Coronado Global Resources with operations in Australia and the United States, followed by manganese mine part-owner Jupiter Mines and Nickel Mines (as the name suggests) and a mix of known and emerging brands including financial services and advisory group Evans Dixon, semi-prepared meal kits supplier Marley Spoon, gas flow control solutions provider to the semi-conductor industry Pivotal Systems and Redcape Hotel Group.
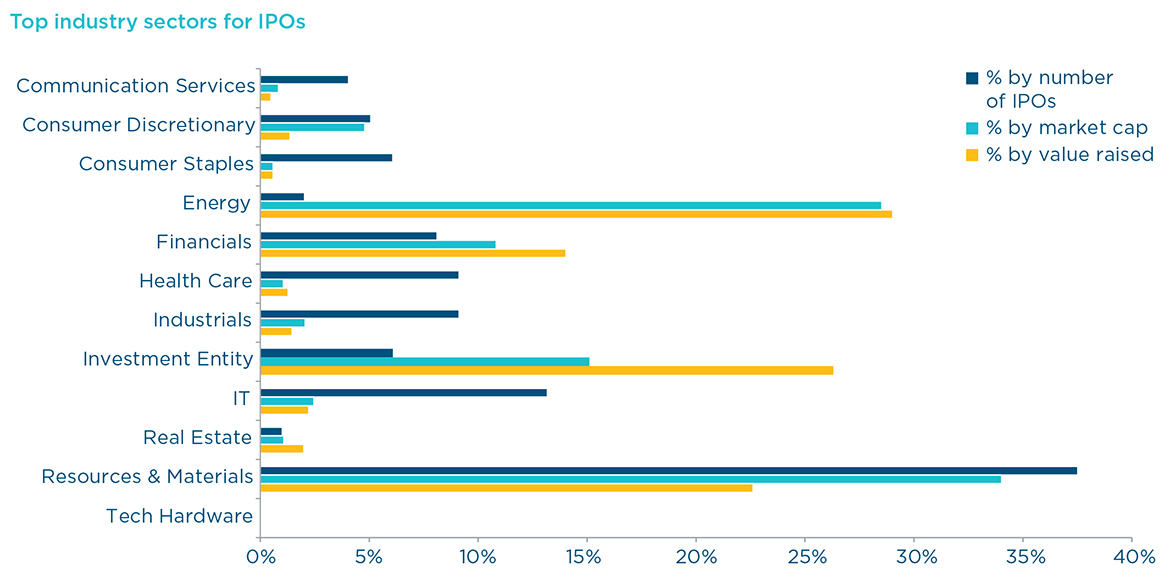
The Viva Energy float is responsible for the bulk of the energy sector’s prominence in this year’s data.
The resurgence in IPOs of prominent mining sector companies marks a return to a traditional strength for the ASX, with the Australian market having a sophisticated understanding of mining investments. Whilst each listing turns on its own facts, a resurgence in stocks that provide the basic materials from which practically everything from infrastructure to consumer goods are built may be indicative of underlying strength in global economic demand that is sometimes masked by headline-grabbing political turbulence.
In 2018 the second most prominent industry sector was small cap IT listings. Following the increase in profits and assets test thresholds for admission to the ASX in 2016, in late 2018 ASX commenced consultation about the introduction of requirements for start-up entities that currently lodge a quarterly cash-flow report to also lodge with ASX a quarterly activities report, similar to the one required by mining, oil and gas exploration entities. ASX’s focus on increasing the robustness of the disclosure framework for start-up entities is admirable, and given the popularity of ASX as a home for start-up listings, it is good to see these kinds of measures being taken.
As with previous years, listed investment entities continued to have a number of listings, raising a significant proportion of the overall capital raised by IPO on the ASX in 2018.

Note on methodology: All data in this ‘2018: IPOs by the numbers’ section excludes ASX Foreign Exempt Listings and debt IPOs unless otherwise stated. Market capitalisation is based on the issue price of securities multiplied by the number of quoted securities.
The contents of this publication are for reference purposes only and may not be current as at the date of accessing this publication. They do not constitute legal advice and should not be relied upon as such. Specific legal advice about your specific circumstances should always be sought separately before taking any action based on this publication.
© Herbert Smith Freehills 2024
We’ll send you the latest insights and briefings tailored to your needs