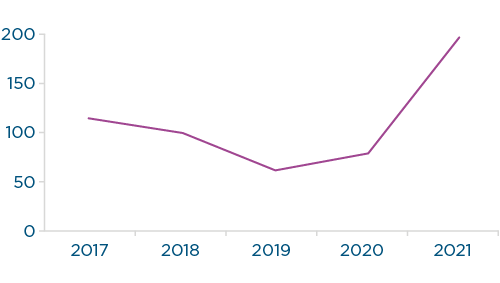
Consistent with global IPO markets, 2021 was a bumper year in Australia, with more IPOs coming to market, more capital raised, and a greater aggregate market capitalisation than each of the last 5 years.
After a challenging 2020, issuers demonstrated confidence, and a greater ability to navigate the ongoing uncertainties of the Covid–19 pandemic, with IPO volume more than doubling the average number of listings since 2017.
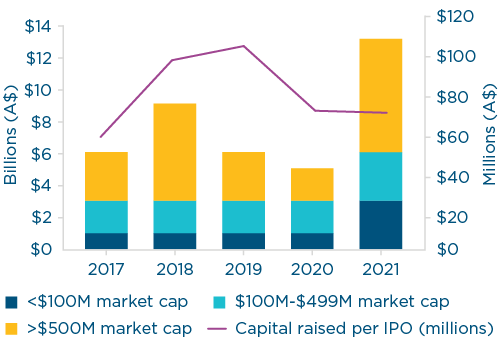
Unsurprisingly, more total capital was raised in 2021, with more than double the amount raised in 2020 and almost $4 billion more than the next highest year (2018).
However, the increase in capital raised in 2021 is mainly a result of the higher number of IPOs, rather than an increase in the average capital raised per IPO. While an outstanding year, this suggests that leftover volume from 2020 has played a part in driving some of this success.
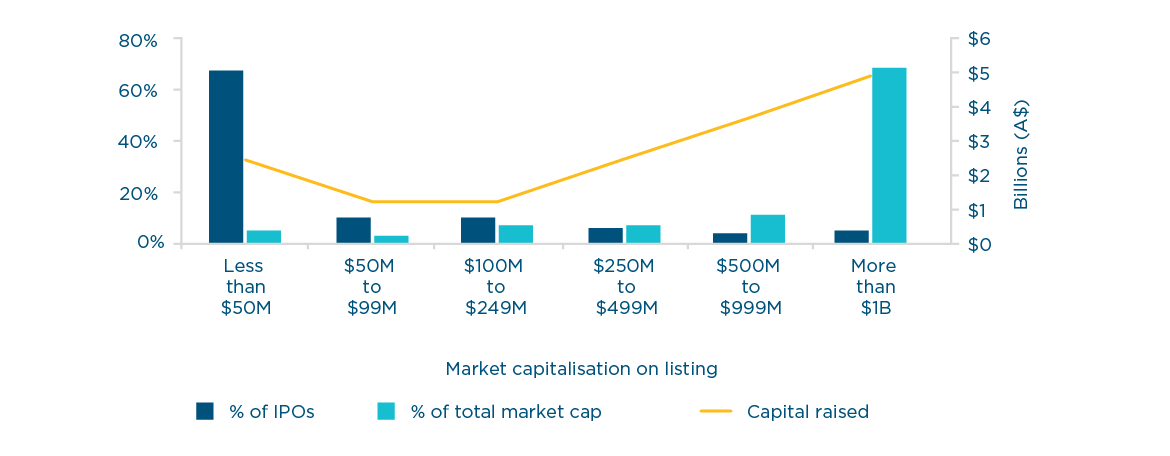
As in prior years, IPOs with a market capitalisation exceeding $1 billion dominated the overall capital raised in 2021, while IPOs with a market capitalisation of less than $50 million comprised the majority of issuances by number, reflecting the long–term strength of the ASX in attracting materials sector listings.
|
Number of IPOs 2017 – 2021 |
Capital raised by market capitalisation and per IPO 2017 – 2021 |
 |
 |
|
IPOs and capital raised by market capitalisation 2021 |
|
Escrow arrangements
Market wide
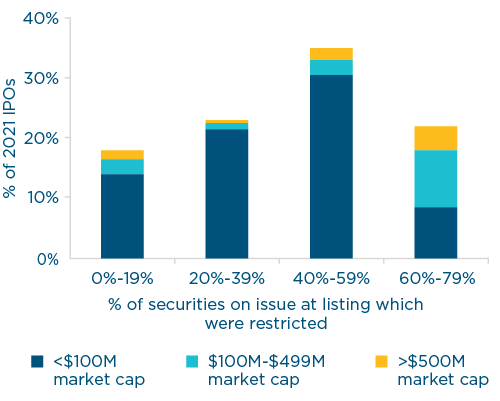
The average IPO in 2021 came to market with approximately 40% of its total outstanding securities in some form of escrow, whether imposed by the ASX or voluntarily restricted by the issuer.
Almost half of all IPOs had between 30–60% of their total outstanding securities restricted upon listing. Larger IPOs tended to exhibit higher levels of restricted securities on listing. IPOs with a market capitalisation over $100 million had an average escrow proportion of closer to 50% and comprised the majority of IPOs with escrow amounts in the 60–80% range.
|
Restricted securities by market capitalisation 2021 |
 |
Large IPOs
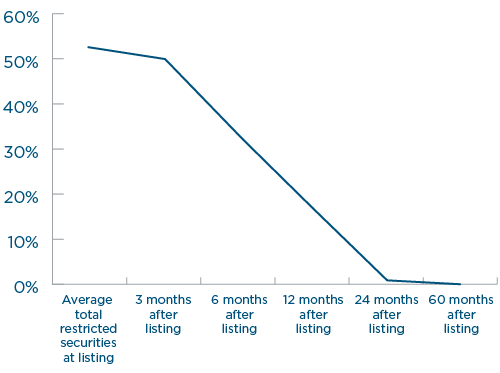
Escrow arrangements featured in all but two (Endeavour and Cobram) of the IPOs with a market capitalisation on listing of over $250 million. These arrangements were predominantly issuer- imposed, with only four of the IPOs facing ASX-imposed restrictions, and three of those four voluntarily restricting more securities than the ASX required. On average, 53% (57% excluding Endeavour and Cobram) of the total outstanding securities were restricted as at the listing date. This average accounts for all escrowed shareholders, including both pre-IPO stakes (such as those held by venture capital, private equity and other investors) as well as founder, director and management shareholders, noting that the latter category typically represented a small proportion of total restricted securities. The higher than market average escrow amount is representative of the trend in large IPOs to require all existing shareholders to enter into escrow arrangements, even where they are not “insiders” or otherwise promoters of the IPO.
Every IPO in this segment scheduled the release of restricted securities in between one to three tranches. Those tranches were most commonly tied to the date of release of the issuer’s financial results (without regard to the quantum of those results), or otherwise to a fixed time period. The vast majority of restricted securities were scheduled to become unrestricted within 24 months of the listing date. Only three issuers adopted a final tranche longer than 24 months after the listing date, at 30, 36 and 60 months respectively. These unusually long tranches generally applied to the CEO and management shareholders or founder CEO. Early release triggers linked to financial performance of the issuer, or its ability to meet financial targets such as forecasts included in the prospectus, were not a feature of the escrow arrangements in this segment of IPOs.
The average release profile of these IPOs is set out below. As shown, the majority of restricted securities were scheduled to be released between three and 12 months from the date of listing.
|
Average large IPO restricted securities release profile 2021 |
 |
Relationship agreements in large IPOsClose to one third of issuers with a market capitalisation on listing of over $250 million entered into “Relationship Agreements” or similar with their major shareholders. Each of those agreements gave the major shareholder rights while they held a certain minimum threshold. That minimum threshold tended to be either 5% or 10% of the issuer’s securities, though only one issuer granted director nomination rights at the lower 5% threshold. In addition to director nomination, those agreements included in each case sell-down assistance and, in all but one instance, certain information access rights. One issuer was also restricted from issuing securities on a non-pro rata basis and the major shareholder had certain rights regarding appointment of the CEO of the issuer. |
Sector spotlights
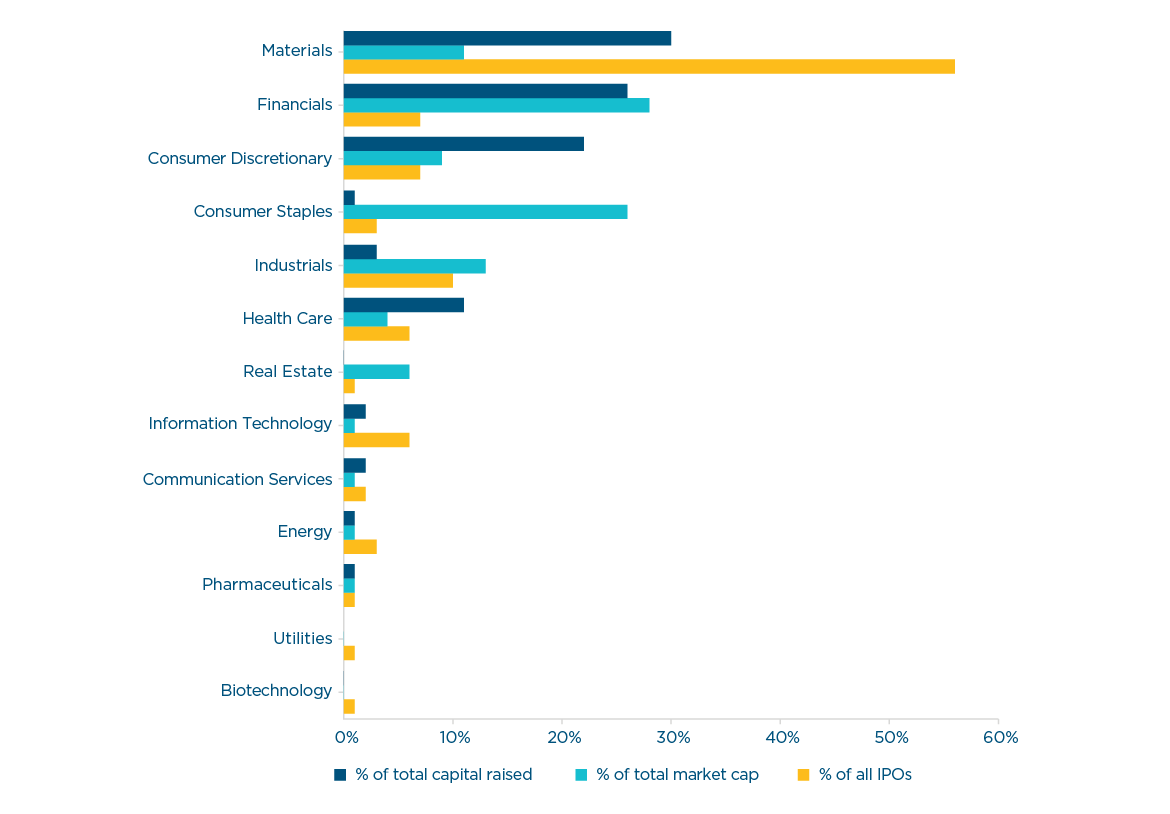
Listings in the materials sector comprised the majority of IPOs in 2021, consistent with the larger overall number of mid- and small-market capitalisation IPOs. By comparison, listings in the financial sector accounted for the largest share of market capitalisation and value raised, at close to 30%. Four of the top ten IPOs by market capitalisation in 2021 were financial sector listings, including GQG Partners, an investment management firm and Judo Capital, a new Australian bank. Latitude and Pepper Money also came to market in 2021, continuing the strong trend of payments and lending focused listings on the ASX.
The PEXA listing drove the strong performance of the real estate sector while the demerger of Endeavour and listing of Cobram lifted the consumer staples sector.
The industrials sector was also well represented, with Ventia, an infrastructure services provider and Li-S Energy, a lithium-sulphur battery producer, coming to market. Health care listings also had a strong showing, led by Australian Clinical Labs, a pathology provider and EBR Systems, a US-based provider of cardiac rhythm management technology.
|
IPOs by sector 2021 |
|
 |
Geographic spread
2021 exhibited a higher proportion of Australian–incorporated issuers than previous years. Nonetheless, the ASX continued to play host to issuers incorporated in Canada, Israel, the United States, the United Kingdom, New Zealand and others.
|
Jurisdiction of issuer incorporation 2021 |
|
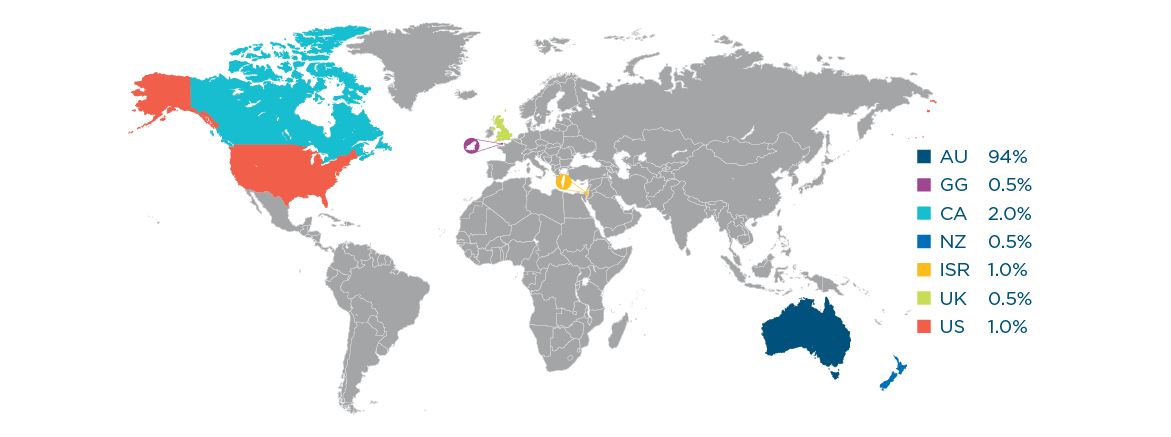 |
Note: This figure does not include issuers incorporated in Australia which have significant strategic, commercial or investor links outside Australia, in which case the non– Australian component would be higher.
Underwriting
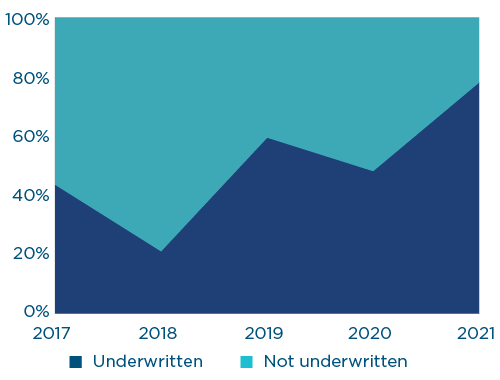
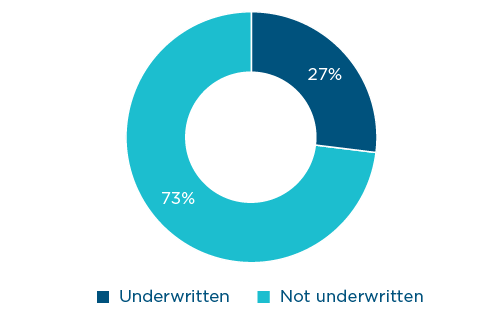
Less IPOs in total were underwritten in 2021 than in 2020 and 2019. The majority of the IPOs which were underwritten in 2021 had market capitalisations over $100 million. Of the IPOs with market capitalisations over $100 million, close to 80% were underwritten – a significant increase from the past several years. This may reflect the desire by issuers for greater certainty for valuable listings given ongoing market conditions and uncertainty.
|
Percentage of underwritten IPOs over $100M market capitalisation 2017 – 2021 |
Percentage of all IPOs underwritten 2021 |
 |
 |
Note on Methodology: All data in this 'IPOs by the numbers’ section excludes ASX Foreign Exempt, AQUA, debt and PDS listings unless otherwise stated. Market capitalisation is based on the issue price of securities multiplied by the total securities on issue on that date.
Key contacts
Legal Notice
The contents of this publication are for reference purposes only and may not be current as at the date of accessing this publication. They do not constitute legal advice and should not be relied upon as such. Specific legal advice about your specific circumstances should always be sought separately before taking any action based on this publication.
© Herbert Smith Freehills 2024
Stay in the know
We’ll send you the latest insights and briefings tailored to your needs


