Stay in the know
We’ll send you the latest insights and briefings tailored to your needs
Consistent with global IPO markets, the Australian IPO market retracted from its 2021 highs, with lower IPO volume than the average of the last 5 years.
Economic conditions in 2022 effectively inverted from 2021, with rising inflation and interest rates contributing to low valuations and uncertainty, particularly for large capitalisation listings. Despite the softening, more IPOs came to market than in 2019 and 2020, signalling the relative comfort of issuers and investors in managing ‘ordinary’ economic cyclicality, as compared to the extraordinary conditions brought about by the Covid-19 pandemic.
Economic conditions were borne out in the composition of IPOs coming to market. Materials listings accounted for almost 70% of all listings in 2022 (2021: 56%), with a further 10% of listings being those in the closely related energy sector (2021: 3%).
The large composition of smaller sized IPOs is reflected in the significant drop in aggregate market capitalisation and capital raised in 2022.
Number of IPOs 2017 – 2022
Capital raised by market capitalisation and per IPO 2017 – 2022
In the 2021 edition of IPOs by the numbers, we found that the increase in aggregate capital raised in 2021 was driven by the increase in the number of IPOs, while the average capital raised per IPO remained consistent with 2020 levels. This suggested that leftover volume from the pandemic-effected 2020 year had contributed to the stellar 2021 market. Notably, in 2022, the reduction in aggregate capital raised is driven by more than the decline in the number of IPOs coming to market – the average capital raised per IPO has also declined significantly. This is consistent with the ASX playing host to a core strength in attracting smaller market capitalisation materials listings in 2022.
Correspondingly, 2022 IPOs had an average first day gain to their offer prices of 12%, down from 23% in 2021.
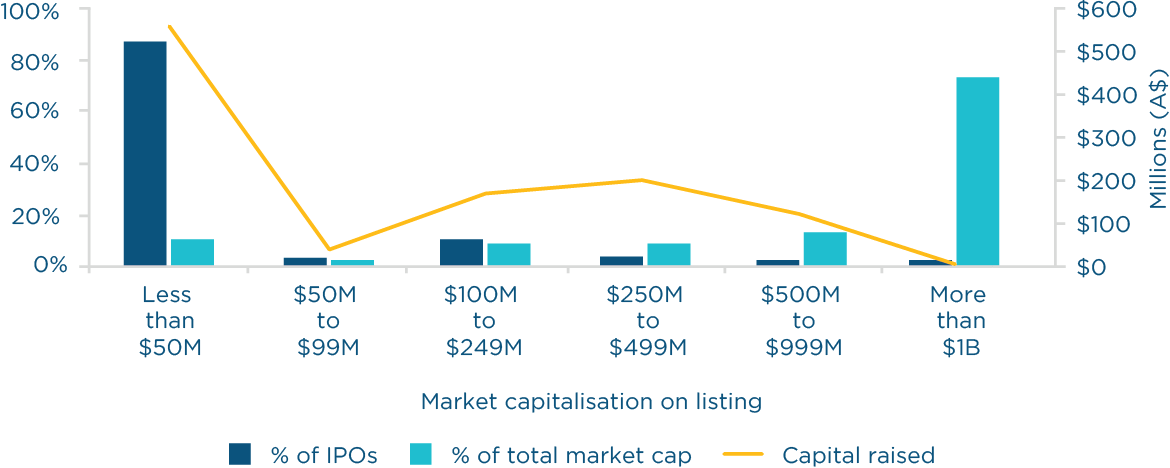
The only Australian listing exceeding $1 billion was Tabcorp’s demerger of The Lottery Corporation (TLC), which did not include a primary raise. Given this, in a departure from prior years, IPOs with a market capitalisation of less than $50 million dominated both the number of listings and capital raised.
Market capitalisation, capital raised and number of IPOs 2022

The average IPO in 2022 came to market with approximately 36% (2021: 40%) of its total outstanding securities in some form of escrow, whether imposed by the ASX or voluntarily restricted by the issuer. Two thirds of all IPOs came to market with 20-60% of their total outstanding securities restricted upon listing.
Larger IPOs tended to exhibit higher levels of restricted securities on listing – IPOs with a market capitalisation over $100 million had an average escrow proportion of 41%. There were only four IPOs with a market capitalisation on listing over $250 million (and only six IPOs with a market capitalisation between $100 million and $250 million).
Restricted securities by market capitalisation 2022
No escrow arrangements applied to the TLC demerger (as is customary for demergers), or the listing of Atlantic Lithium Limited, which was granted an ASX waiver from restricting securities on the basis of its continuous prior listing on AIM, a sub-market of the London Stock Exchange. Of the other two IPOs with a market capitalisation of more than $250 million, the average escrowed stock on listing was 41%, in each case with all restricted securities released within 24 months of the listing date (with some held by employees released at 12 months).
Early release triggers linked to financial performance of the issuer, or its ability to meet financial targets such as forecasts included in the prospectus, only featured in one IPO, Conrad Asia Energy, which included an early release from 6 months after the date of listing based on a volume weighted average price trigger.
Consistent with the composition of IPOs in 2022 being dominated by smaller materials listings, we did not observe any IPO-specific relationship agreements entered into between issuers and their major shareholders. In one instance, Atlantic Lithium Limited, an agreement between the issuer and major shareholder entered into several years before the IPO gave the shareholder continuing rights to appoint certain directors of the issuer.
|
Insider and Investor holdings 25 prospectuses included an explicit disclosure of the breakdown of restricted securities held by founders, directors and management (Insiders). On average, approximately 85% of Insiders’ total securities were restricted for at least some period upon listing, with 17 of those 25 listings requiring 100% or close to 100% of the Insider holdings to be locked up for a period. In all but one instance, all escrowed stock was released within 24 months of the listing date, with most issuers also adopting a partial release within 12 months of the listing date. We expect the requirement for a substantial amount of Insider stock to be restricted at listing to continue, particularly where Insiders hold a significant amount of the existing shares on issue. This is consistent with the sample above, where the restricted Insiders stock represented, on average, the majority of stock escrowed by that issuer. 18 prospectuses included an explicit disclosure of the breakdown of restricted securities held by pre-IPO investors such as venture capitalists, private equity and other substantial shareholders (Investors). On average, 62% of Investors’ stock was restricted on listing. The lower average relative to Insiders reflects the long-standing balancing act between recognising an IPO as an exit event while requiring pre-IPO Investors to maintain “skin in the game”. |
As noted above, materials listings comprised the majority of IPOs in 2022, and for the first time in several years, also the majority of total capital raised. Issuers with gold exploration activities accounted for over one third of these listings.
The next most frequent materials listing were lithium miners, who also accounted for the two largest materials listings by market capitalisation – Leo Lithium Limited and Atlantic Lithium Limited. This may be indicative of the increased global demand for battery technology and components, and reflect energy transition dynamics. Indeed, a number of materials listings explicitly described their activities by reference to battery technology and the energy transition.
Consistently, the next largest sector by number of IPOs was the closely related energy sector, dominated by the listing of natural gas exploration company Conrad Asia Energy Ltd. Together, materials and energy listings accounted for 64% of the capital raised and 18% of the overall market capitalisation on listing in 2022.
The TLC demerger drove the outperformance of the consumer discretionary sector, while the listing of Chrysos Corporation Limited, the owner of the CSIRO developed PhotonAssay technology which notably services the mining industry, dominated the capital raised by information technology listings (of which there were only two other listings in 2022).
While muted in comparison to previous years, financial and health care sector listings did continue to come to market, with Beforepay Group Limited continuing the recent trend of payments technology listings on the ASX.
IPOs by sector 2022
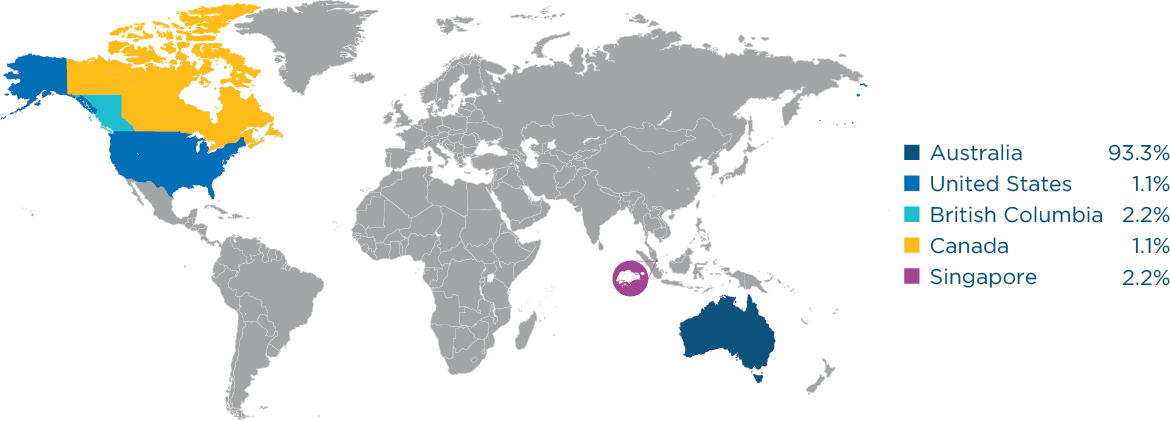
The larger than average proportion of Australian-incorporated issuers in 2022 was consistent with 2021 levels, reflecting globally soft IPO volumes and economic uncertainties. Nonetheless, the ASX continued to attract listings from key international jurisdictions including the United States and Canada.
Jurisdiction of issuer incorporation 2022

Note: This figure does not include issuers incorporated in Australia which have significant strategic, commercial or investor links outside Australia, in which case the non-Australian component would be higher.
Only 7% of IPOs by number were underwritten in 2022 (2021: 27%, which was itself low). All but one of the listings underwritten in 2022 had a market capitalisation over $100 million. Of the IPOs with market capitalisations over $100 million, only 50% (2021: 80%) were underwritten.
This may reflect the composition of IPOs in 2022, with lower overall capital being raised and predominance of materials listings contributing to reduced demand for underwriting.
Percentage underwriting of IPOs over $100M market capitalisation 2017-2022
Percentage of IPOs underwritten 2022
Note on methodology: All data in this ‘IPOs by the numbers’ section excludes ASX Foreign Exempt, AQUA, debt and PDS listings unless otherwise stated. Market capitalisation is based on the issue price of securities multiplied by the total securities on issue on that date.
The contents of this publication are for reference purposes only and may not be current as at the date of accessing this publication. They do not constitute legal advice and should not be relied upon as such. Specific legal advice about your specific circumstances should always be sought separately before taking any action based on this publication.
© Herbert Smith Freehills 2024
We’ll send you the latest insights and briefings tailored to your needs